

.png)


.webp?width=160&height=90&name=download%20(17).webp)
.webp?width=160&height=72&name=download%20(18).webp)

.webp?width=160&height=90&name=download%20(22).webp)
.webp?width=160&height=75&name=download%20(24).webp)
Provide Context
Understand how your frontline employee turnover and feedback compares to industry standards, giving meaning to your data.
Identify Strengths & Weaknesses
Inform Decision-Making
Establish a basis for making strategic decisions about employee engagement and retention.
Enhance Accountability
Understand where you stand relative to your peers and industry leaders.
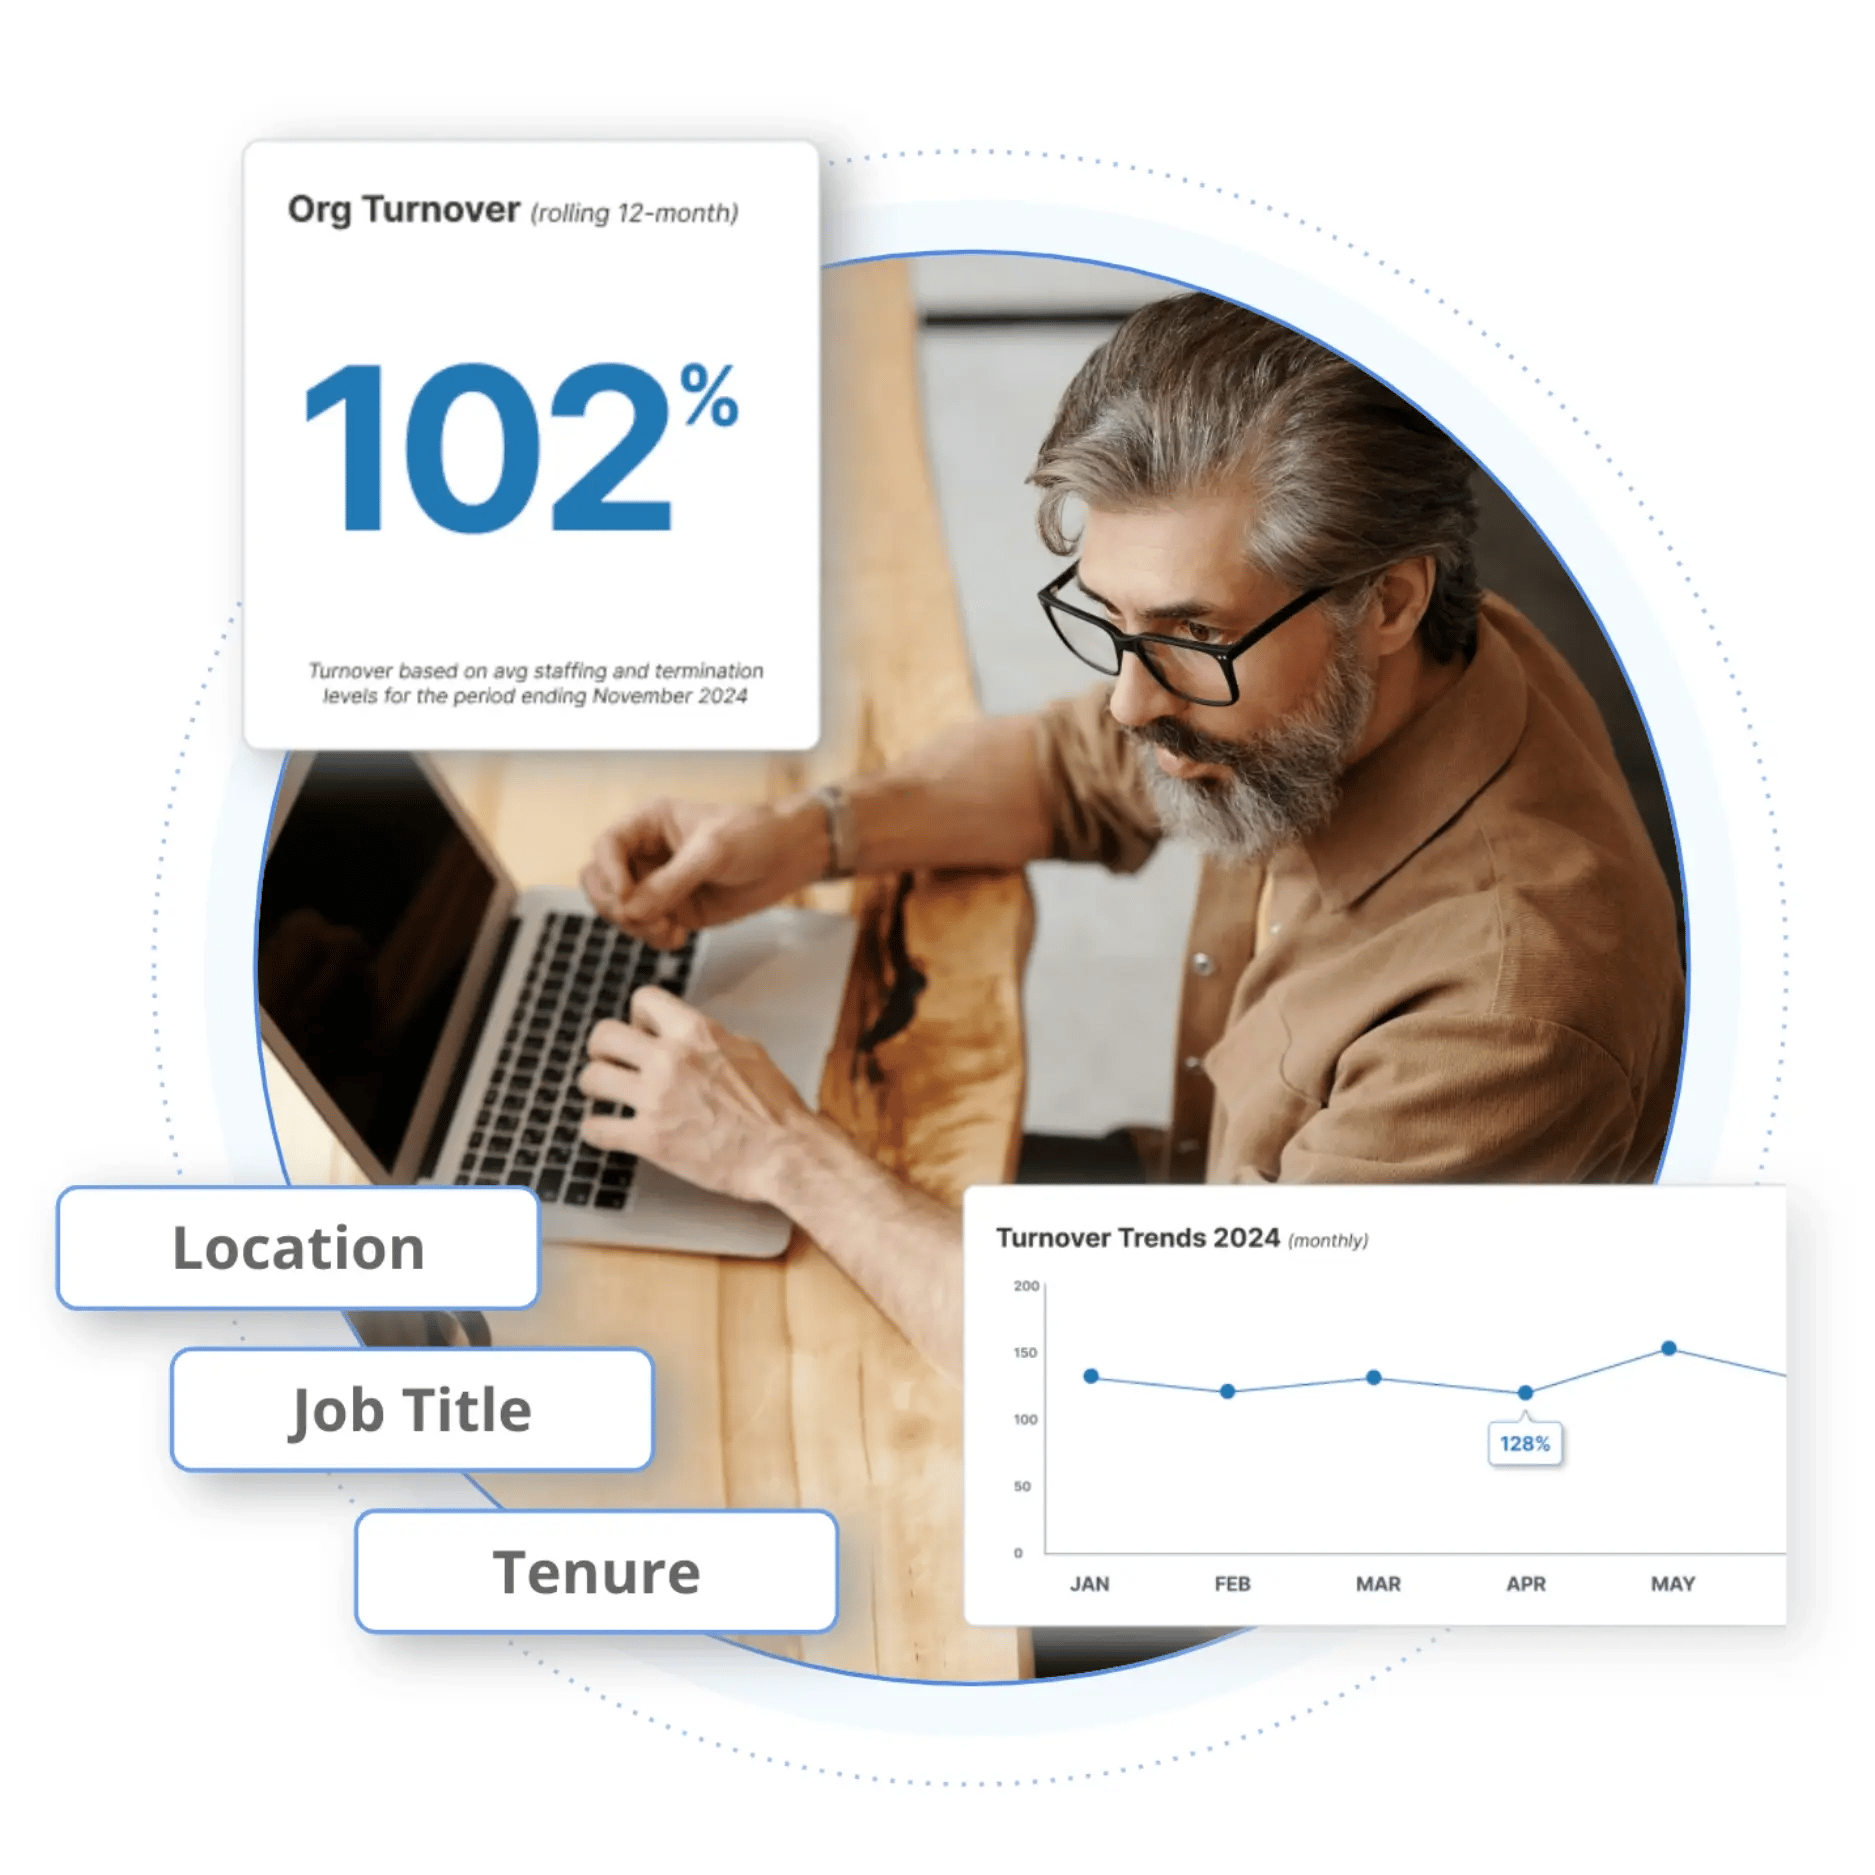
TURNOVER ANALYTICS & BENCHMARKING
Workforce stability insights
- Meaningful Trends: Gain a comprehensive view of turnover patterns with rolling 12-month, yearly, quarterly, and monthly breakdowns, delivering the insights needed to take action before issues escalate.
- Granular Breakdown and Benchmarking: Analyze turnover by account, location, and job title for a precise understanding of where challenges exist and how they compare to industry-specific benchmarks.
- Customer-First Simplicity: Turnover Analytics integrates seamlessly with most HRIS and payroll systems, requiring minimal setup so you can start seeing insights right away.
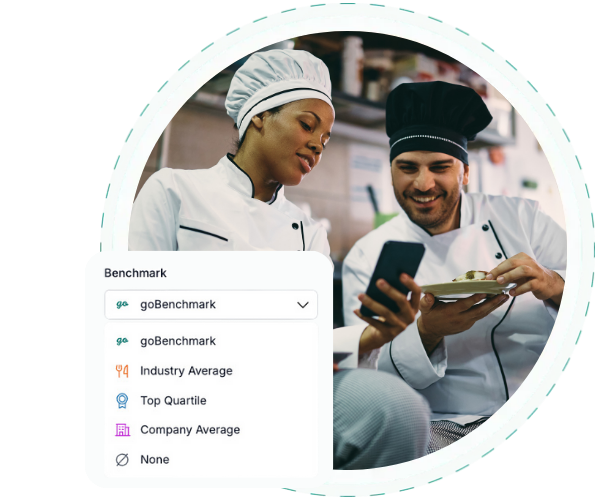
ARE MY RESULTS GOOD?
Why benchmarking matters
Benchmarking provides the context your organization needs to understand your survey results in comparison to other companies. Discover strengths, identify areas for improvement, and make data-driven decisions that enhance employee engagement and retention.
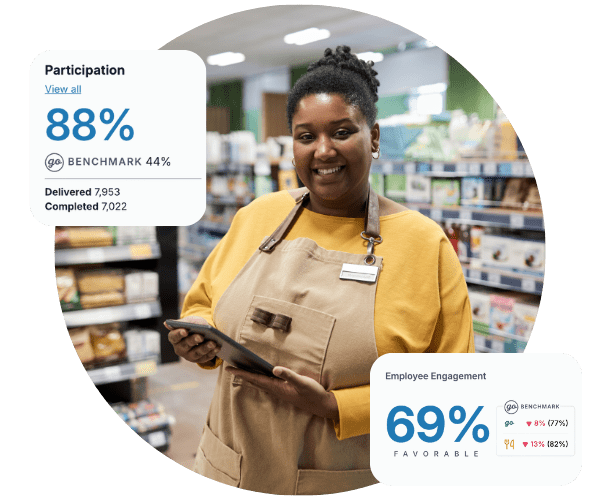
FRONTLINE ANALYTICS BENEFITS
Designed for the frontline
- Industry-Specific Data: Tailored insights using fresh data from like-minded companies focused on frontline worker happiness and engagement.
- Easy to Read Dashboards: Real-time access to dashboards that provide comparisons of turnover data and key metrics from goPowered New Hire, Exit and Employee Engagement surveys.
- Benchmark Analysis: Compare your organization’s performance against industry benchmarks or across all goHappy customers for filtered results.

"goHappy just keeps getting better and better. The new Benchmarking feature allows us to validate our progress well beyond measuring against ourselves. Now we can see how we stack up versus our industry peer group as well as the goHappy customer base. It's helping us focus on exactly where we need to channel our energy in order to be best in class."
